
Built for athletes.
See where you rank — one test gives a rating against real norms.
See where you rank.
One test result gives a rating against real norms for your sport, gender and level — and an early read on the sport your profile is built for.
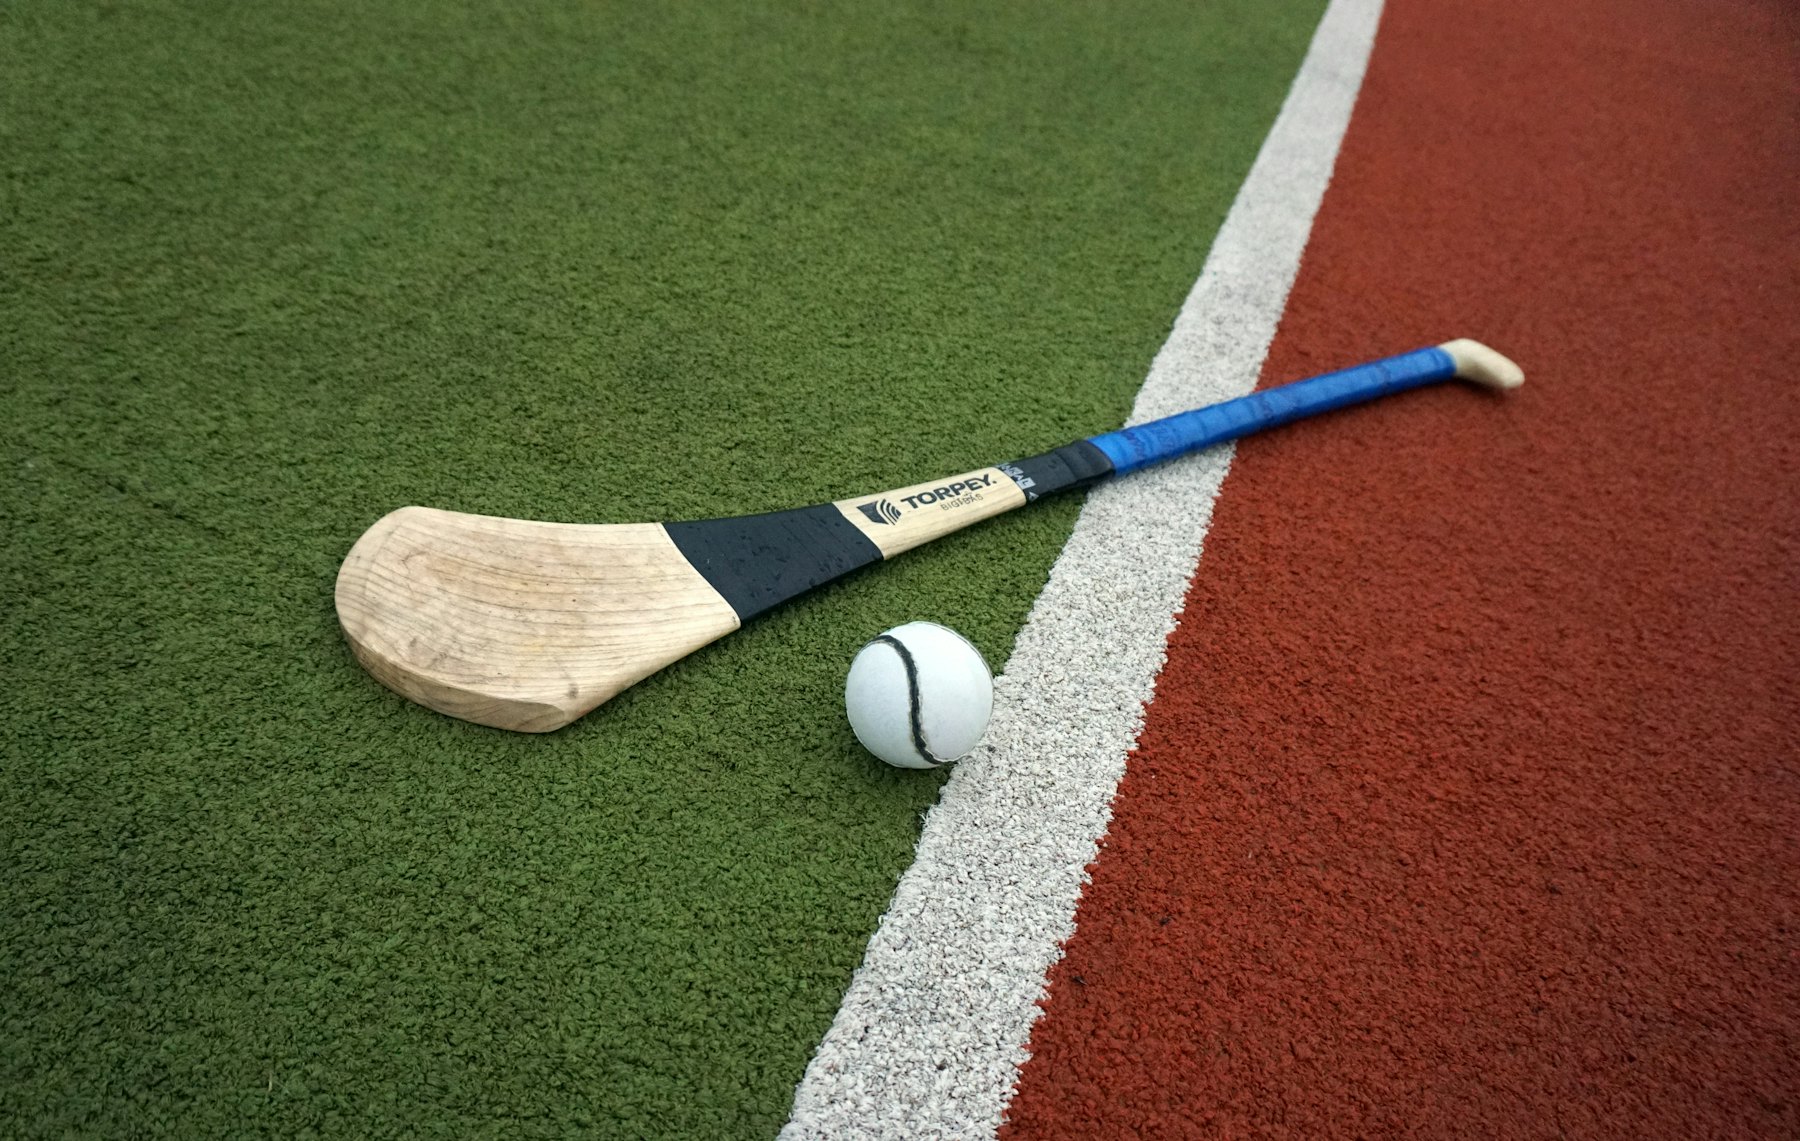
Benchmark every athlete you coach.
Generate a testing sheet, run the session, import the results — every athlete's numbers in before training ends, rated against named norms on the Advanced and Pro plans. Sprint, throws, forwards, backs: your training groups are free and unlimited on every plan, whether you coach a field-sport squad or twelve individuals.
Every squad, one picture.
Readiness, form and injury flags across every team in your club — football, hurling and camogie sides side by side, with training groups inside each team, unlimited on every plan.

From a number to a decision.
Very good
29.0 cm, measured 2026-06-15 — a published reference: girls and women in Ladies Gaelic Football, ages 17-40
29.0 cm of jump height is one number. Rated against a published reference for this athlete's gender and age it reads very good. The 3 inputs beneath it each carry a band and a date: 1 against a published reference, and 2 illustrative, marked as such, where no published reference exists yet for this sport. That is the difference between a score and a decision. Work the lowest-rated input first: time from the 505 Agility Test (an illustrative rating).
| Input | Value | Band | Measured |
|---|---|---|---|
| Jump Height (Counter-Movement Jump) (Example)Example figure | 29.0 cm | Very good Compared with a published reference: girls and women in Ladies Gaelic Football, ages 17-40; n = 92 (Hughes et al. 2024). | measured 2026-06-15 |
| Change since 2026-04-13 (Example)27.1 → 29.0 cmExample figure | +1.9 cm | Not ratedA change is arithmetic over two measurements, not a value a norm set rates — the direction of travel is the right one. | measured 2026-06-15 |
| Time (20m Sprint) (Example)Example figure | 3.45 s | Average Compared with a published reference: girls and women in Ladies Gaelic Football, ages 16-45; n = 106 (McGuinness et al. 2026). | measured 2026-06-15 |
| Accumulated Distance (Yo-Yo Intermittent Recovery Test L1) (Example)Example figure | 984 m | ExcellentIllustrative rating | measured 2026-06-15 |
| Time (505 Agility Test) (Example)Example figure | 2.57 s | PoorIllustrative rating | measured 2026-06-15 |
Every figure above is illustrative: an example athlete, not a real person, and no real athlete's data is ever shown on this page. Ratings marked “Illustrative rating” are examples too; the rest are rated against the published reference named on the row.
Solid marks a measured value; dotted marks one the platform calculates from other values. Every value on this card is an example.
Enter a test
A jump height, a sprint time, a grip score — one number you already know is enough to start.
under 90 secondsSee your rating
Rated on a six-band scale against real published norms for your sport, gender and level.
625 norm setsDiscover your sport
Cross-sport suitability shows where your physical profile ranks highest — and what to test next.
24 sports compared